Statistics
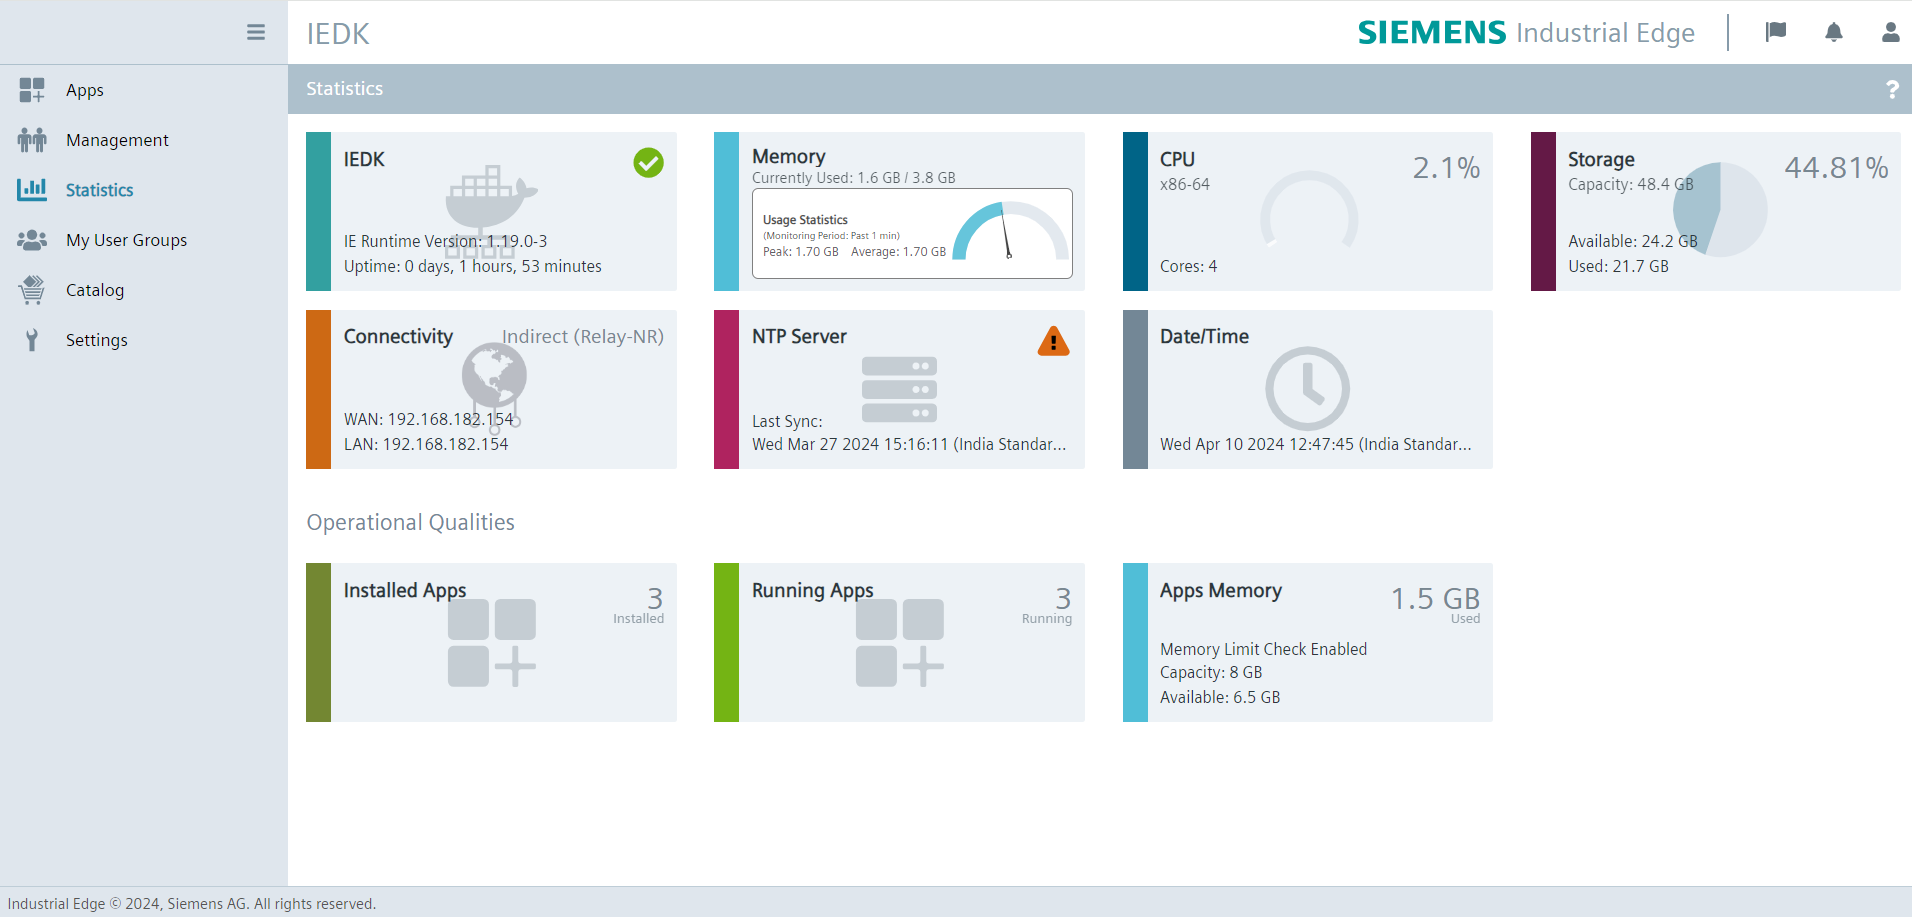
In the Statistics screen, you get an overview about the main statistics and system properties of your Edge Device.
Memory, CPU and storage
The display of memory, CPU, and storage depends on the settings that the Edge Device Builder configures for that Edge Device type.
Memory
The Memory tile displays the current memory usage and usage statistics for the Edge Device.
The usage statistics include the peak and average memory usage based on the previous audit period.
The monitoring period can be defined by the user in Settings > Edge Management Timers > Public Edge Device Analytics.
The usage statistics contain a gauge that displays the average memory consumption in percentage.
The color of the tile is based on the average memory consumption.
In addition, the storage tile displays a warning or critical alert icon when a warning or critical alert occurs,
when the memory exceeds the thresholds set by the user in Settings > Edge Device Alerts > Memory(%).
The icon includes a tooltip that displays the time and memory usage of the spike.
Apps Memory
The memory limit check is enabled by default. This check limits the number of applications that can be installed and run on an Edge Device based on the required and available memory.
If the memory limit check is disabled, applications can be installed and run without memory limitations.
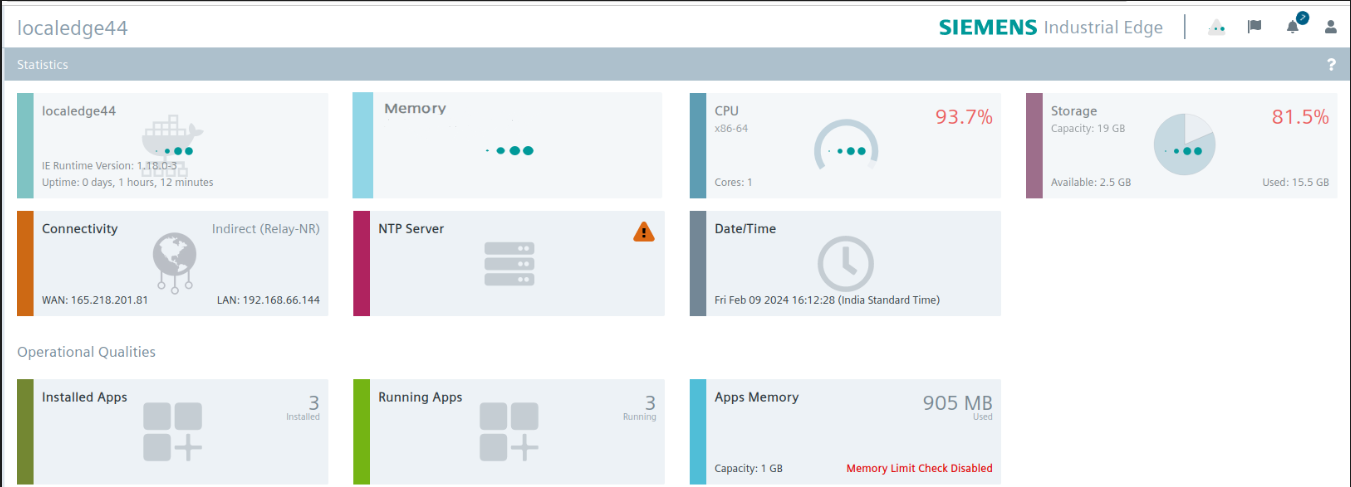
NTP Server
The NTP Server tile displays the status of the NTP server.
The NTP server status is monitored by default every hour.
You can edit the time interval under Settings > Configuration > NTP Health Status Timers.
Refreshing
Refresh the Edge Device UI if you change system properties to see the changes in the statistics information. Otherwise, outdated information will be still displayed.