Interaction with the system apps
To test your first app as you did in the previous section, you have to deploy two system apps of the Industrial Edge.
Go back to the IEM and open the catalog. Install the Databus and SIMATIC Flow Creator app to the IED with your app.

Click on the app icons and then on 'Install'. Select your IED and click on 'Install Now'. This will take a minute.
You will see the app in the IED 'Apps' tab after successful deployment.
Configuration on Databus
You must do some configuration on the Databus to make it executable on the IED with your app. The Databus does not allow anonymous publishing or subscription of a MQTT client on any topic. Therefore, you must configure the Databus with your Industrial Edge app topics.
In the IEM, go to 'My Installed Apps'. Click on the Databus of your IED.

Open the configuration of the Databus as shown in the figure Open configuration of Databus and the figure Databus configuration to work with your app.
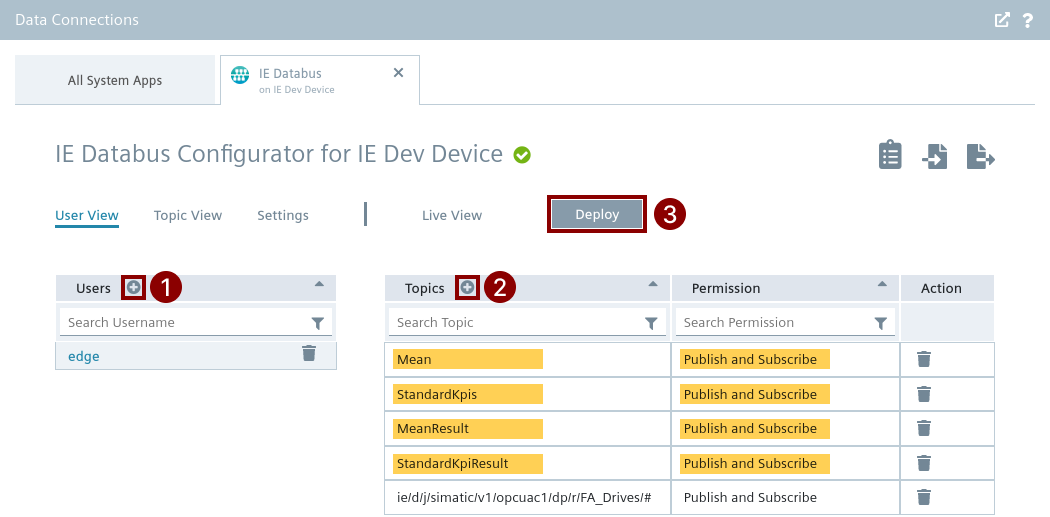
- Create a user called 'edge' with password 'edge' by clicking on the
icon
- Add the four topics of your app to this user
- Deploy the configuration to the Databus on the IED
NOTICE
Do not directly close the window until the process of applying the configuration is finished.
Restart your app
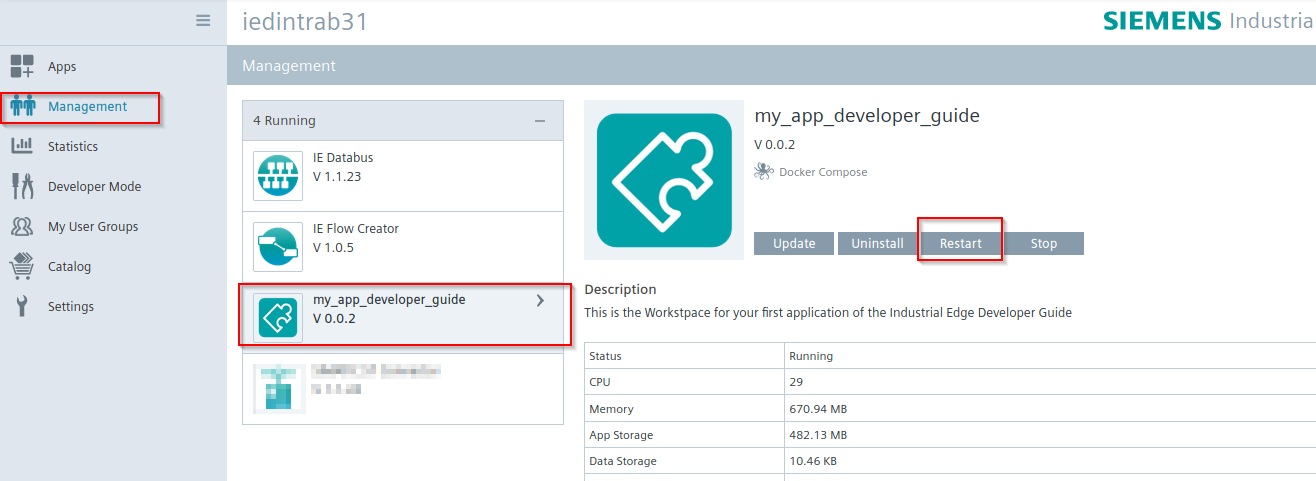
You must go back to IED and open 'Management' to restart your app to successfully connect your data_analytics container to the Databus. Click on 'Restart' as shown in the figure Restart of your app to connect properly to Databus.
Install InfluxDB plugin on SIMATIC Flow Creator
Once you have applied the configuration successfully to the Databus and your first app has been restarted successfully, open the SIMATIC Flow Creator app by clicking on the icon. A new tab in your web browser opens with a login window. Please log in with your IED login data as an admin.
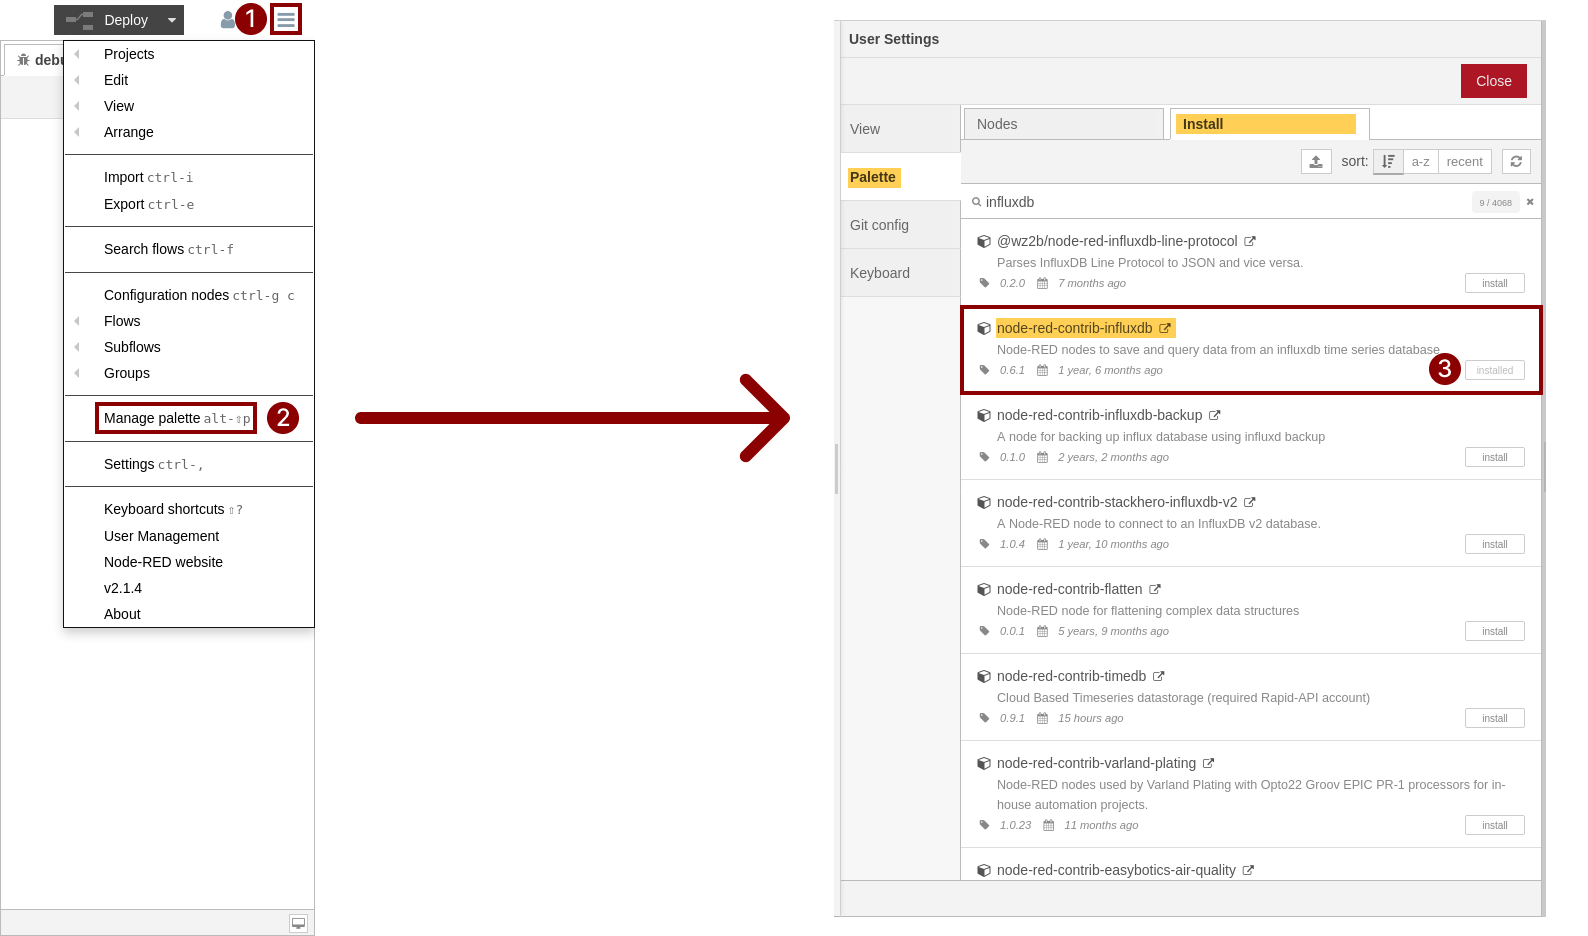
First, you must install the InfluxDB plugin on the SIMATIC Flow Creator. Open 'Manage palette' as shown in the figure Install InfluxDB plugin in SIMATIC Flow Creator. Click on the 'Install' tab and type 'influxdb' and select the result 'node-red-contrib-influxdb' and click on 'Install'.
You can import an adapted flow as you have already tested with Node-RED in the previous section.
Therefore click on 'Import' in the menu and 'Select a file to import' as your first app is already shipped with a pre-built data generation flow called 'flow_data_gen.json' in the folder 'SIMATIC Flow Creator Flows'.
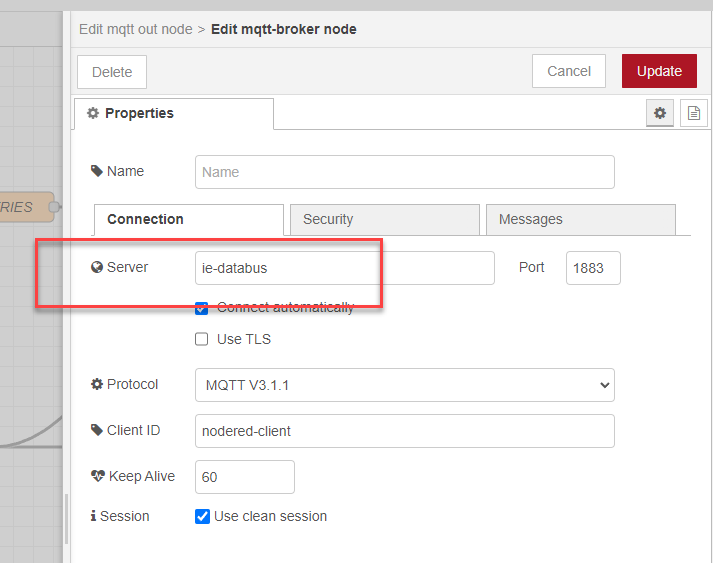
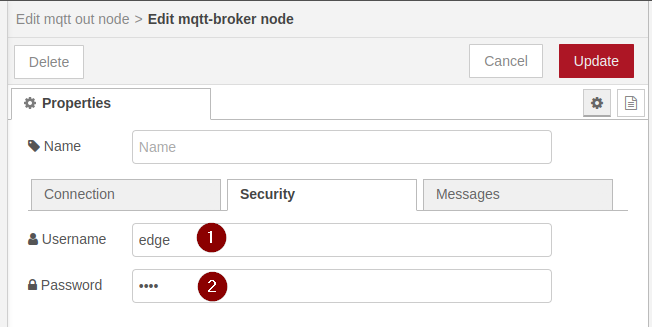
After importing the flows, configure the mqtt broker node by changing the server name to ie-databus, username to 'edge' and password to 'edge'.
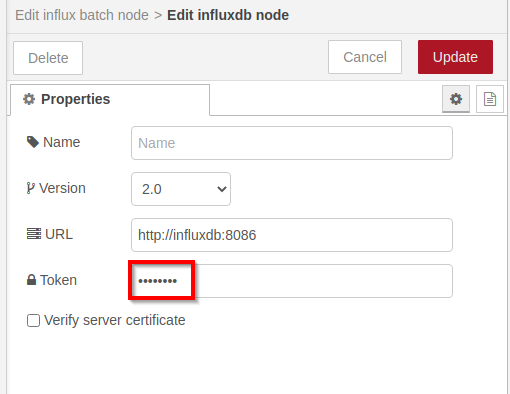
Also configure the influxdb node token to 'testtoken'.
You can now test the flow:
Check your InfluxDB UI
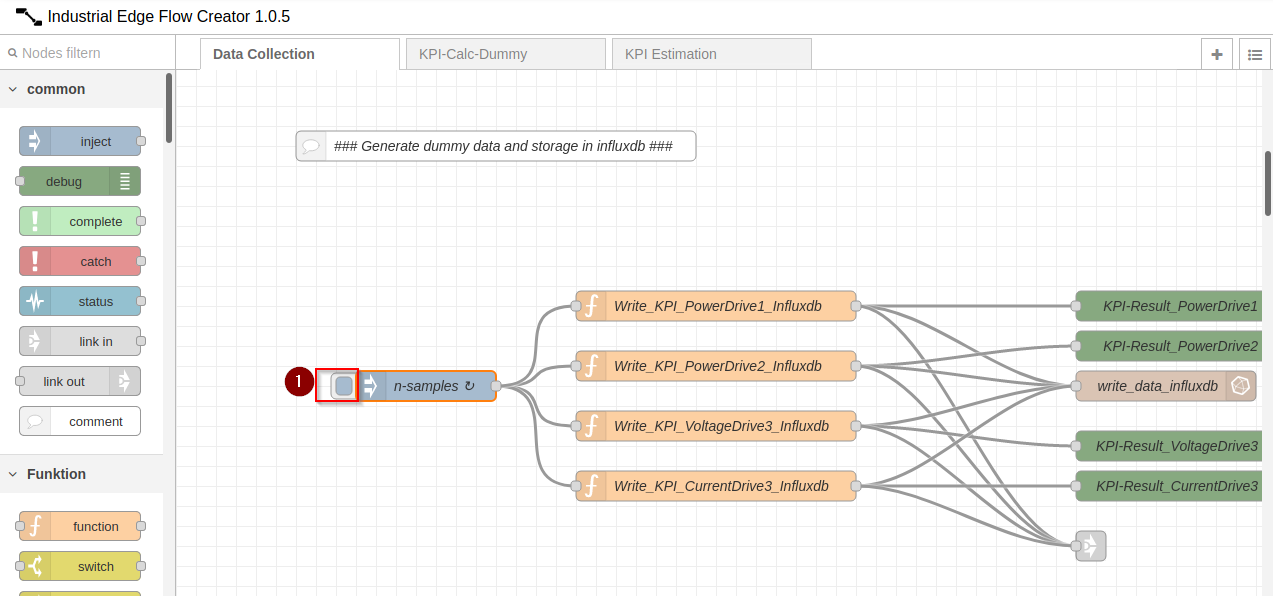
Start the data generation by clicking on the node as shown in the figure Start data generation in imported flow in the SIMATIC Flow Creator. Open the InfluxDB web view by clicking on your apps icon on the IED website. You may need to import the dashboard again. To do that, please refer to the previous section - Test InfluxDB & Node-RED
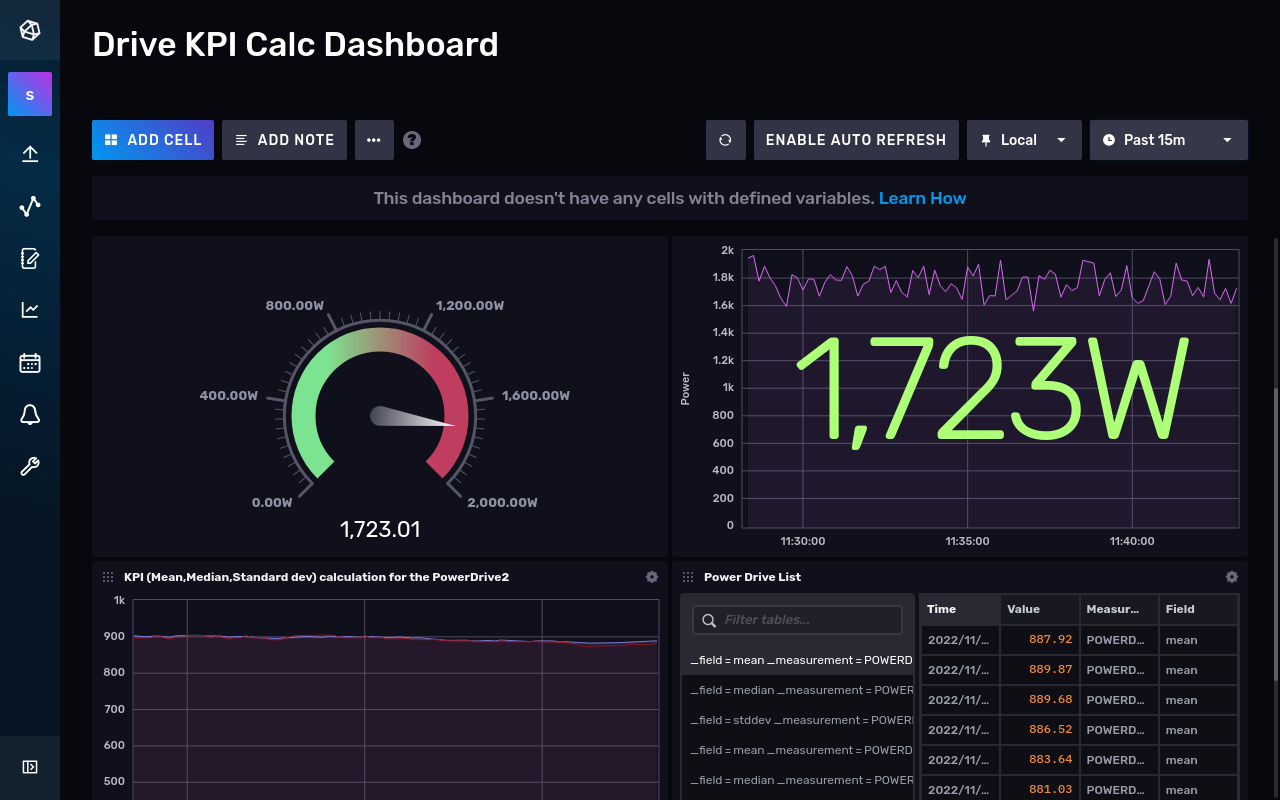
The view should contain data as shown in the figure InfluxDB Dashboard with data from your first running app on the IED
NOTICE
You have successfully verified your first app with generated data on an IED.
Establish connectivity in your app
The next step is to connect the SIMATIC Flow Creator to an OPC UA server to collect real-world data.
You will need an OPC UA server
For this guide you will need your own OPC UA server as a real PLC or simulation (SIMATIC S7-PLCSIM Advanced). The OPC UA server should be available and accessible in the same network. You can use an existing TIA project available on GitHub.
Install OPC UA Connector
First, another system app called OPC UA Connector needs to be installed to the IED where your app is running.

Select your IED after clicking on 'Install' as shown in the figure System app OPC UA Connector in IEM Catalog. This may take a few minutes.
Configure the OPC UA Connector
After the installation is completed, go to the menu item 'Data Connections'. Click on 'OPC UA Connector', select your IE device and launch the Configurator by clicking on 'Launch' as shown in the figure Open configuration of OPC UA Connector.

A new window of the OPC UA Connector opens in which you can add data sources by clicking on 'Add Data Source' as shown in the figure Add data source to OPC UA Connector configuration.

Select OPC UA as the 'Data Source Type' and provide the required information, such as Name, URL, Port and Security levels. Our test server supports the security mode 'None' and 'Anonymous'. This configuration depends on the endpoints of your OPC UA server.
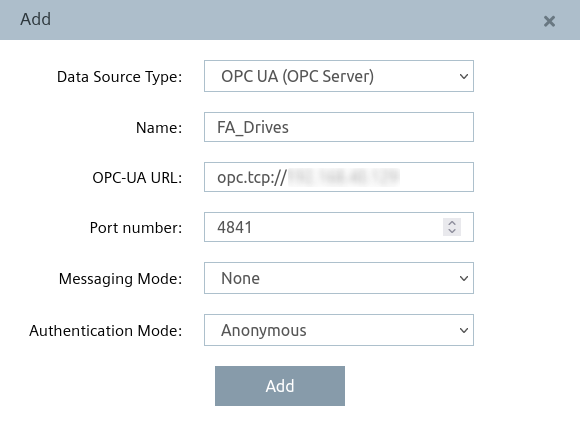
Create the data source
Click on 'Add' to create the data source. By clicking on the icon of the 'FA_Drives' as shown in the figure Add OPC UA node to data source 'FA_Drives', you can add nodes of your OPC UA server.

Enter a name for the node, which can be anything; in this case, we'll use 'powerdrive1' as shown in the figure Add OPC UA node 'powerdrive1'. The address will vary depending on your OPC UA server. It consists of namespace index (ns) and the node id (s). The data type is then set to Real because we are reading a float value. The value is checked every 2 seconds and is only read when it changes.

You can add multiple nodes at once by pressing the button. This will be done for the next three nodes 'powerdrive2', 'voltagedrive3' and 'currentdrive3'. Afterwards, click on the 'Add Tags' button. The result should look something like the table in the figure Configured nodes in OPC UA Connector.

If you are using the miscellaneous project then it should look something like this:
| Name | Address | Data Type | Acquisition Cycle | Acquisition Mode | Access Mode |
|---|---|---|---|---|---|
| powerdrive1 | ns=3;s="GDB"."signals"."energySignals"."energyConsumptionFillingTank" | Real | 1 second | CyclicOnChange | Read |
| powerdrive2 | ns=3;s="GDB"."signals"."energySignals"."energyConsumptionHeatingTank" | Real | 1 second | CyclicOnChange | Read |
| voltagedrive3 | ns=3;s="GDB"."signals"."tankSignals"."actLevel" | Real | 1 second | CyclicOnChange | Read |
| currentdrive3 | ns=3;s="GDB"."signals"."bottleSignals"."actLevel" | Real | 1 second | CyclicOnChange | Read |
General settings of OPC UA Connector
Next, you have to configure the databus to which the data is published. This is shown in the figure General settings of OPC UA Connector. Enter the name of the Databus. The user is 'edge' and the password is 'edge'. Do not select Bulk Publish. Bulk Publish means that all the data is collected in a cycle and sent as a single array with all the values of the configured nodes.

After saving the configuration, select all nodes and press the 'Deploy' button. When the deployment is complete, you should see green checkmarks next to the nodes and be able to click on 'Start Project'. If the connector was successfully started, a green checkmark should also appear next to the 'Bus Adaptor', and the status cell next to the Data Source name ('Fa_Drives') should display a green circle indicating that the connection to the OPC UA server has been established.

NOTICE
The OPC UA Connector is configured and completed.
Publish results to Databus
To allow the OPC UA Connector to publish the results and to consume them in the SIMATIC Flow Creator, you must add an additional topic to the Databus app. Open the configuration of the Databus on the IEM for your IED.
You must add the following topic 'ie/d/j/simatic/v1/opcuac1/dp/r/FA_Drives/#' to your 'edge' user as shown in the figure Add 'FA_Drives' OPC UA Connector to Databus. Select all topics and deploy them to the IED.

The topic is organized as follows:
- ie represents Industrial Edge
- d represents data
- j represents datatype - json
- opcuac1 represents the OPC UA Connector Instance 1
- dp represents datapoint
- r represents read operation
- FA_Drives represents the data source name
- # represents all subtopics under FA_Drives
NOTICE
For further information about the topic structure of the Industrial Edge Databus. Please refer to the official documentation.
Now the OPC UA Connector can publish the data cyclically to the Databus on the configured subtopics of 'FA_Drives'.
NOTICE
Please restart your OPC UA Connector.
Data consumption in Node-RED
Now you must consume the data, which is published by the OPC UA Connector on the Databus. Open the SIMATIC Flow Creator app on your IED. You can import the predefined flow from the folder 'SIMATIC Flow Creator Flows' as the JSON file 'flow_data_S7_Connector.json'. Instead of generating the flow, it contains a new flow which is shown in the figure SIMATIC Flow Creator flow to consume data and preprocessing.

The flow consumes the data on the four topics of the OPC UA Connector with the corresponding json structure. The structure is preprocessed to store it suitably for the InfluxDB.
Check the data in InfluxDB
Deploy your flow in the SIMATIC Flow Creator and open the InfluxDB web view of your app on the IED.
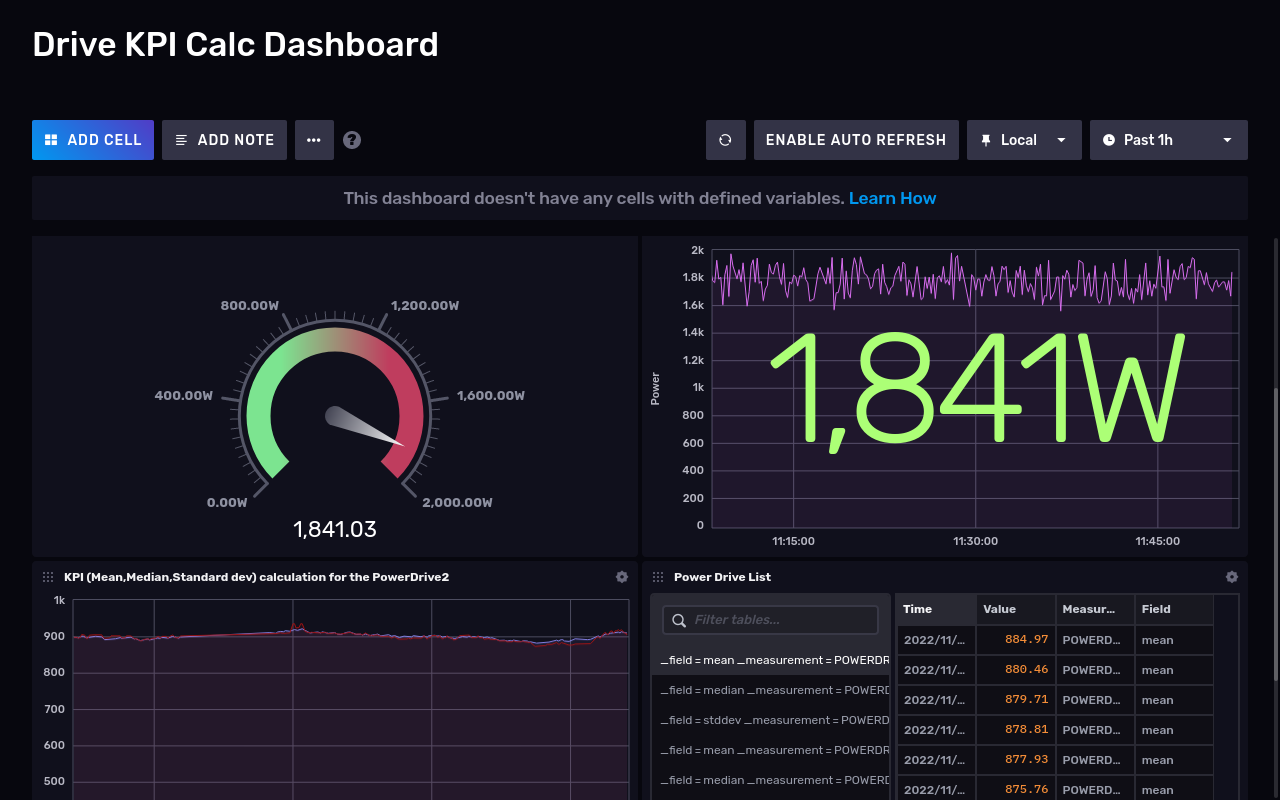
InfluxDB Dashboard shows the visualization of the real-world data of the drives.
You have successfully combined multiple system apps to consume real-world data, preprocess the data, store it and use it for analytics. Finally you also created a visualization of the data for end users.