App testing in development environment
To test your first app in the development environment, the three modules listed below must be started in the correct order.
Test your app in the following order:
-
Start a terminal in the 'mqtt_broker_mosquitto' folder under /src/solution/HandsOn_1
-
Execute command
docker-compose up -din the first terminal. -
Start another terminal in the 'my_edge_app' folder under /src/solution/HandsOn_1
-
Execute command
docker-compose up -din the second terminal. -
Start yet another terminal in the 'node_red' folder under /src/solution/HandsOn_1
-
Execute command
docker-compose up -din the third terminal. -
Execute command
docker psto see if all containers are running. The console output will look like the figure Docker PS command after all docker-compose up of your app

As all containers of your first app are running in your development environment, you can open a web browser on your development machine.
Test InfluxDB and Node-RED
Now we will open two tabs in the web browser:
- http://localhost:38086 for InfluxDB
- http://localhost:33080 for Node-RED
You will see the login page of InfluxDB and the Node-RED flow creator page with prebuilt flow to test your Industrial Edge app. Both websites are shown in the figure Websites of InfluxDB and Node-RED container.

First, you need to set the Influxdb Token as 'testtoken' inside the Node-RED, as shown in the following figure:
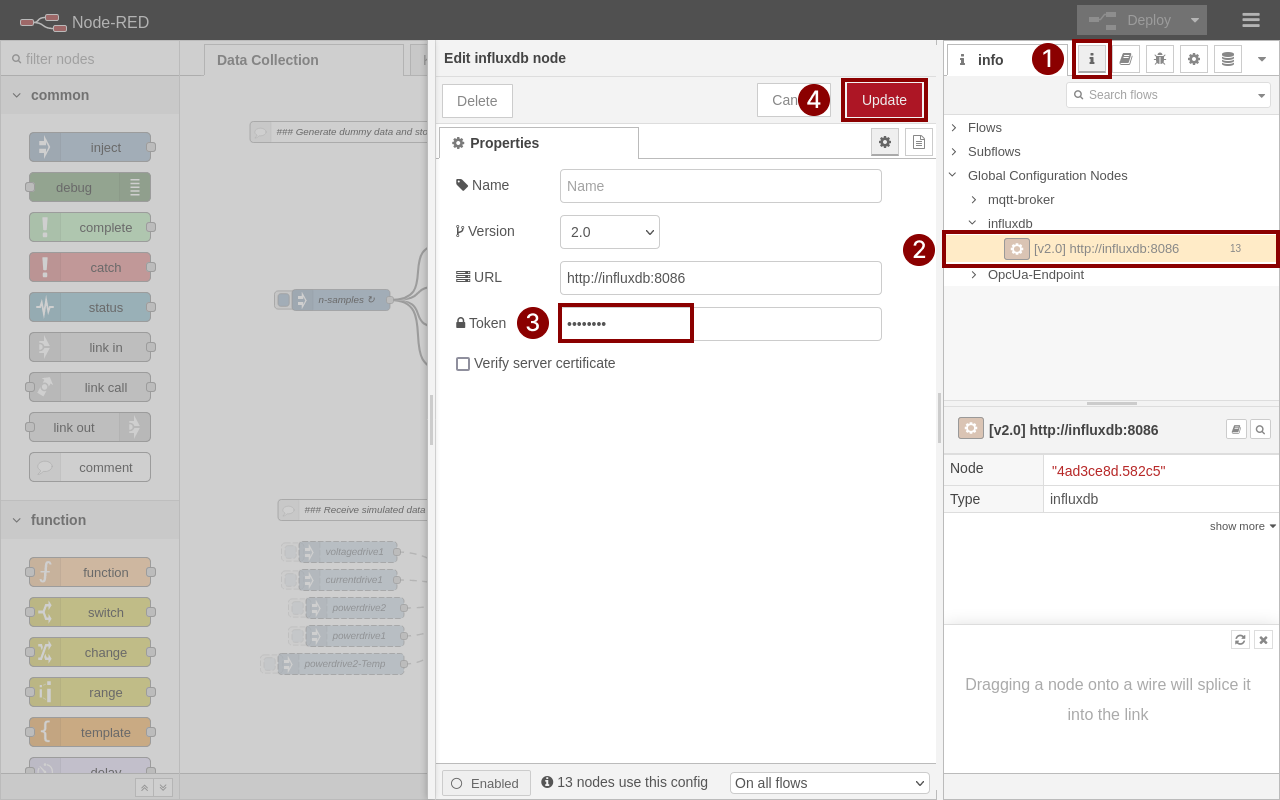
Now you can log in to InfluxDB with username 'edge' and password 'edgeadmin'.
You can open the demo dashboard for your Industrial Edge app by clicking on 'Dashboards' in the menu. Afterwards import the pre-configured dashboard by clicking on '+ Create Dashboard' → 'Import Dashboard'. Navigate to the influxdb folder and select 'drive_kpi_calc_dashboard.json'. By clicking on 'Import Json as Dashboard', a new dashboard will be created and you should see it in the overview. Click on the 'Drive KPI Calc Dashboard'. You will see a dashboard view similar to the one in the figure Navigation in InfluxDB to open dashboard of your app.
NOTICE
You might not see any data, because you did not generate it via Node-RED flow.
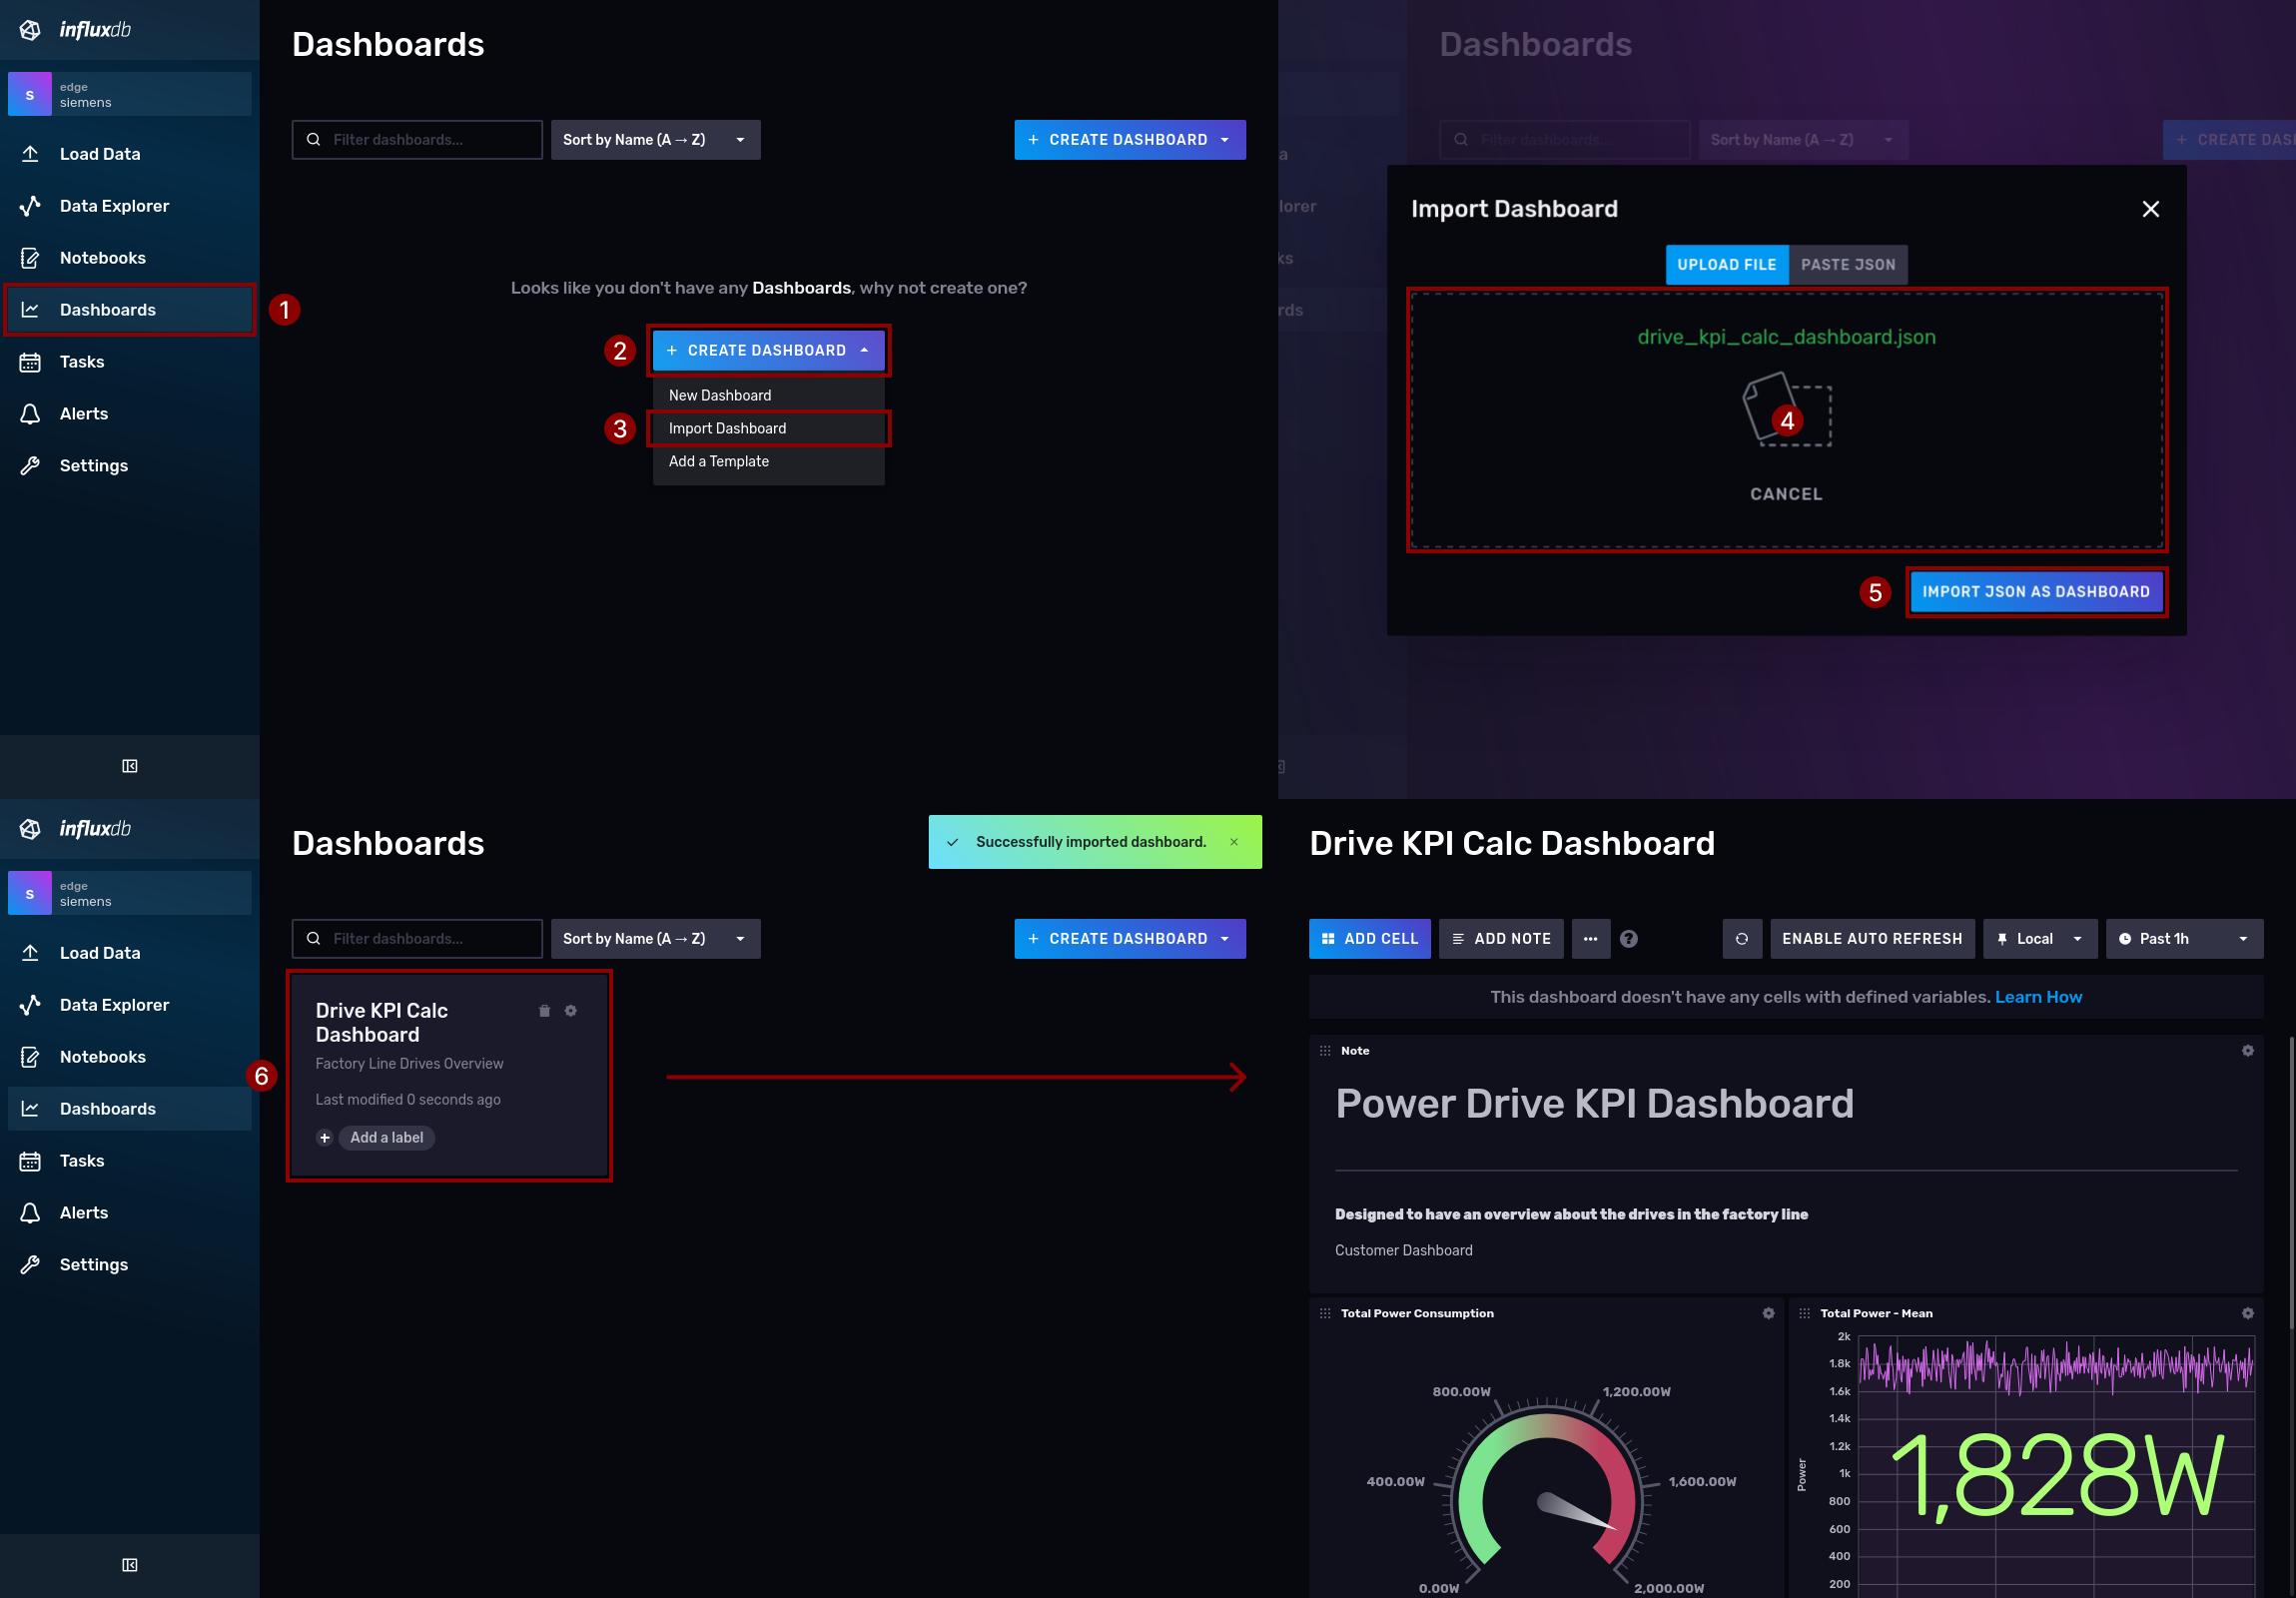
To see the visualization of data from your 'data-analytics' app, you have to trigger the data generation in the Node-RED flow.
Introduction to Node-RED flow
First, you will get an introduction to the Node-RED flow. The current use case involves gathering two power measurements from two drives, as well as an additional drive's current and voltage. The raw data is stored in the InfluxDB. A collection of measured data is queried from the database to prepare an array of that data to be sent to the 'data-analytics' container. Additionally, the "data-analytics" calculated data is received and saved in the InfluxDB.
Therefore, the existing flow is divided into three parts:
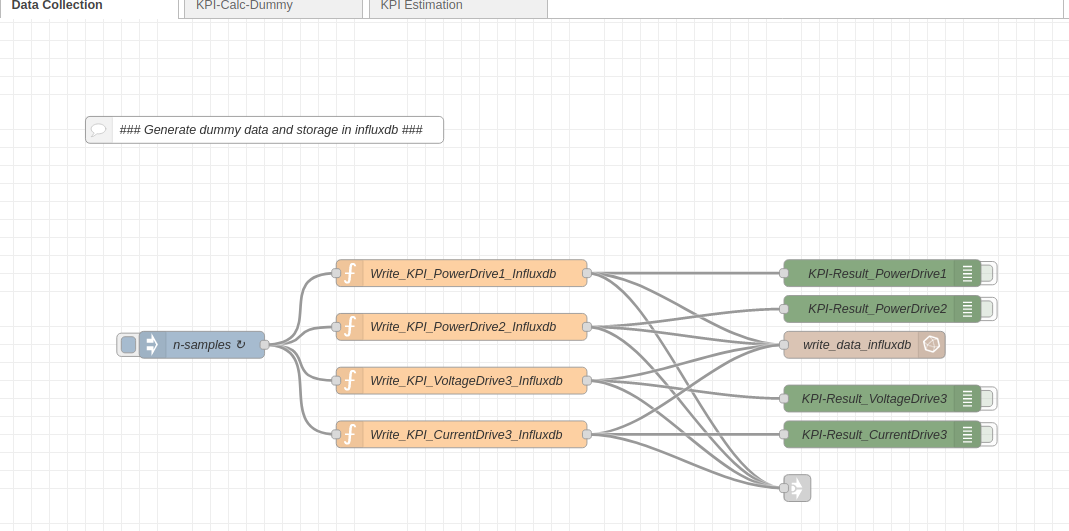
Data collection
This flow contains a trigger which will fire events every 10 seconds. In the function nodes, random data is created for the power of the drives as well as the current and voltage. It will be written to the InfluxDB database. All created values are redirected to the flow 'KPI Estimation'.
KPI-Calc-Dummy
This flow queries the stored power values of the two drives and calculates their total power. It is also stored in InfluxDB.

KPI Estimation
The surrounded flow in the upper area of the figure Flow to prepare data for data analytics and consume results filters the incoming JSON messages from the flow 'Data Collection'. The upper flow will query the power of drive 1 and 2 and collect the last 50 entries from the database and publish them to the MQTT topic 'StandardKpis'. The other flow is querying the last 50 voltage and current values of drive 3 from the database. Both are joined together as a single message to be published to the MQTT topic 'Mean'. The flow outside of the red rectangle is listening for the MQTT topics 'StandardKpiResult' and 'MeanResult'. The result messages are preprocessed to store the data-analytics results in the InfluxDB as well.
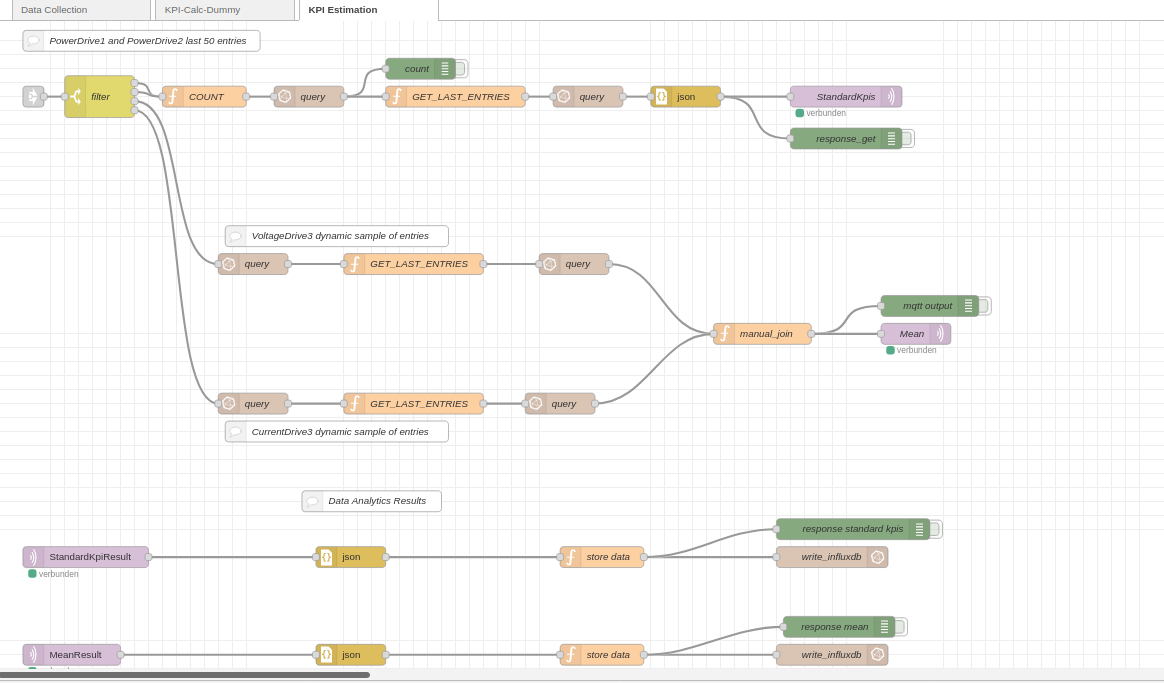
If the flow has not been deployed yet or if any changes have been made, please click on the red Deploy button at the top right of the Node-RED website. Please click the trigger in the flow 'Data Collection' to start data generation.
Results
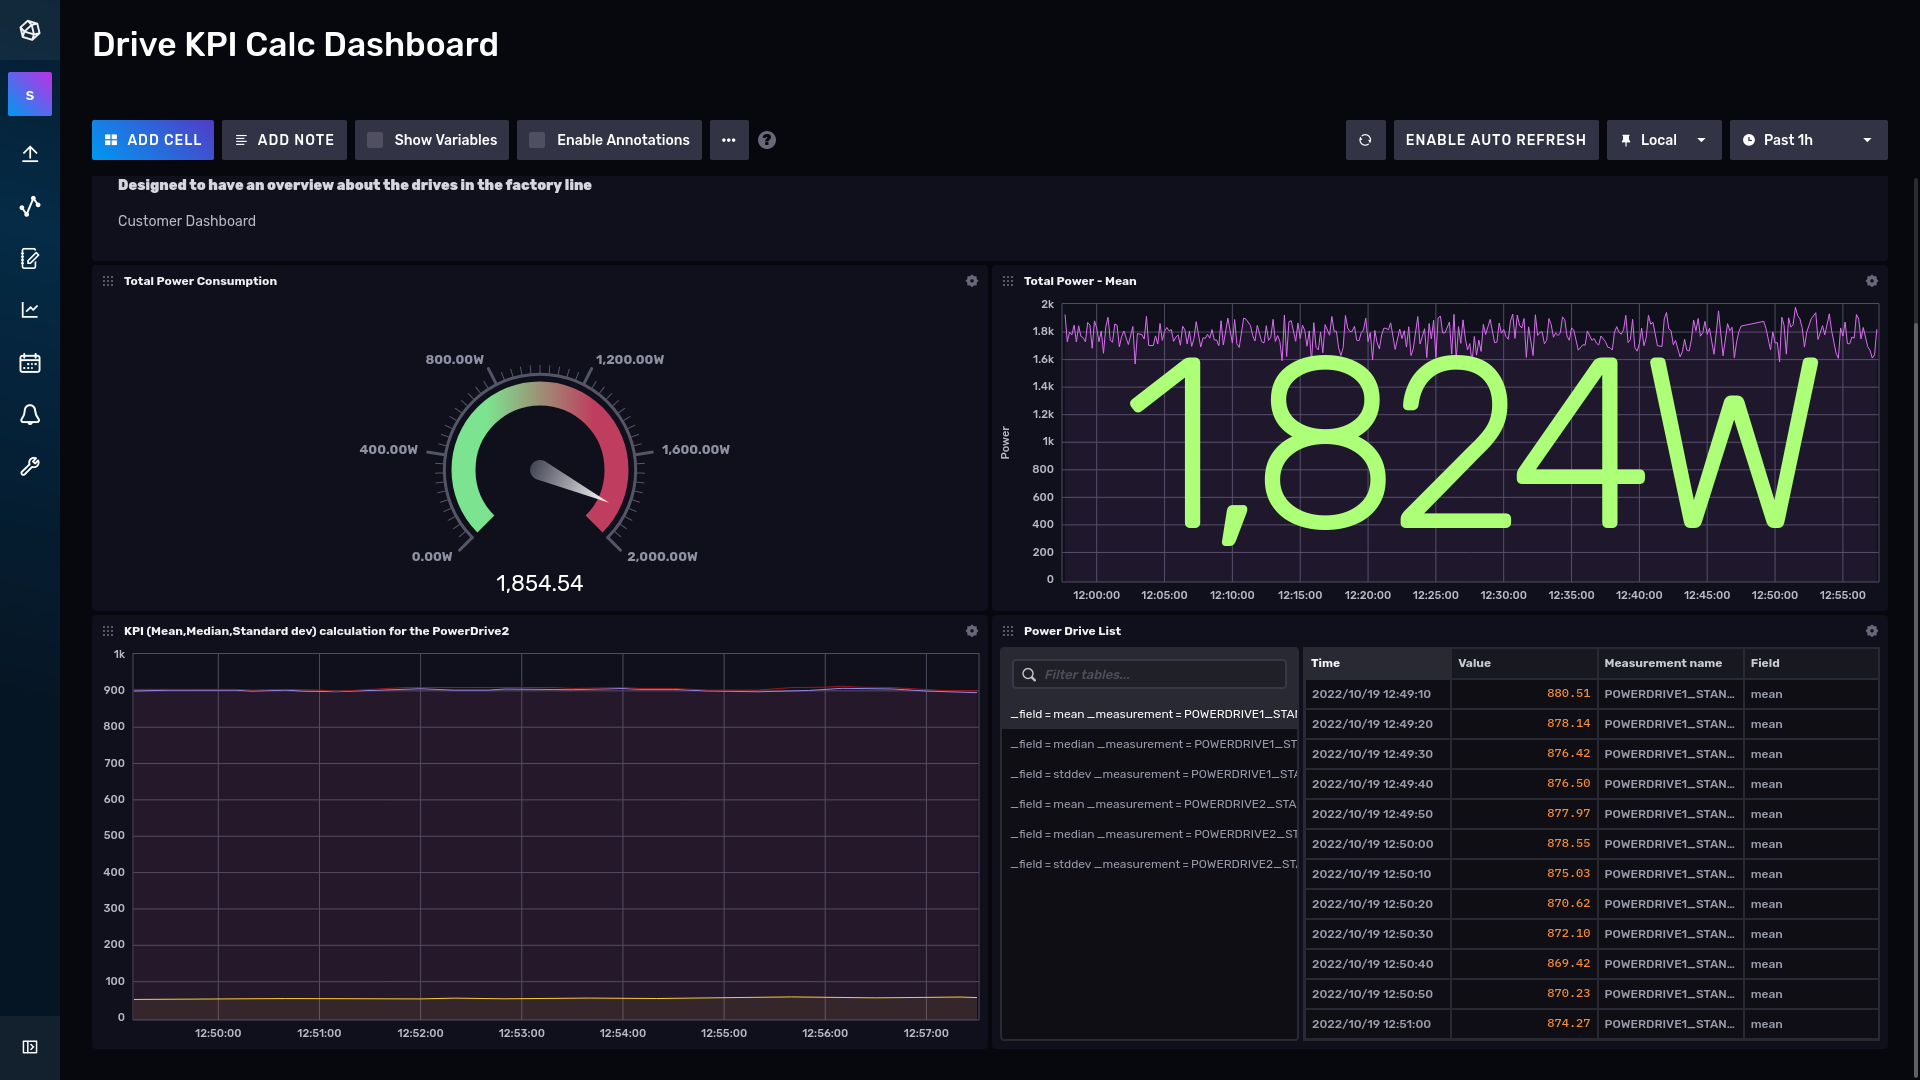
You can switch to InfluxDB again, and you will see a visualization of data as soon as enough data is available and has been processed by data-analytics. Your InfluxDB dashboard should look like the figure Dashboard with stored data from data-analytics loaded from InfluxDB.
NOTICE
Congratulations! Your first Industrial Edge app is working and you can continue the next preparation steps to bring it to your Industrial Edge device!"